Like any financial asset, commodity, or collectible, comic book values fluctuate in the course of natural course of trading. We can measure this fluctuation by calculating its variance or standard deviation. Variance is a measure of how far a string of variables lie from their mean, or expected value. Often it is easier to work with standard deviation, which is the square root of variance, because the dispersion is expressed in the same units as the data we’re interested in. For comic book values, the standard deviation will be measured in dollars.
Certain stocks and other tradable commodities have more variance and standard deviation than others. In the financial world, a stock’s fluctuation is typically referred to as volatility. Volatility is used by many as a gauge of a stock’s risk. So a large company like Procter & Gamble or Nike will be deemed to be less risky than a high-flying tech stock like Groupon or Salesforce.com. Over the course of a year, Nike will probably have a standard deviation similar to that of the whole stock market (15-20%) whereas Groupon will have volatility that could be twice as much (30-50%). What this means for an investor is that if Nike averages $90 for the year, he or she could expect it to fluctuate between approximately $70 and $100. On the other hand, Groupon could average $20 and swing violently between $10 and $30.
While a high standard deviation can mean high risk, volatility can actually be your friend. How? By giving you the opportunity to buy a stock at a low price. The same goes for comic books!
I spend a lot of time examining completed CGC graded comic book transactions from eBay, the major auction houses (e.g., Heritage, Pedigree, etc.), and other online auction sites and private sales. Given the frequency at which many of the key titles trade, and the healthy supply across all the auction sites, I’m always surprised when I see a title trade at the top end of its recent range. Frequently collectors will buy comics at values one or more standard deviations away from their mean value. These collectors simply aren’t taking advantage of trading patterns. By being a tad more patient—and aware of recent trends—they could save themselves a lot of money.
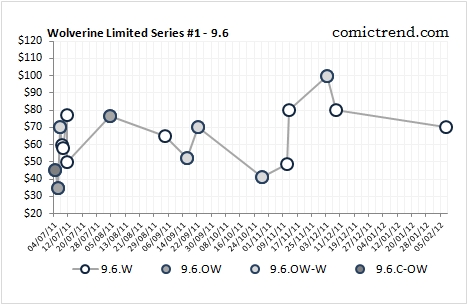
Let’s look at a recent example of this. Below is a graph of recent sales for Wolverine Limited Series #1 with a 9.6 grade. I chose this book because it’s frequently traded with a high census. From the chart it is clear that recent transactions have fluctuated between $40 and $100. Note that page colour does not seem to matter in this case; copies with off-white-to-white and off-white pages valued just as highly as those with white pages (page colour will be a topic for a future By the Numbers).
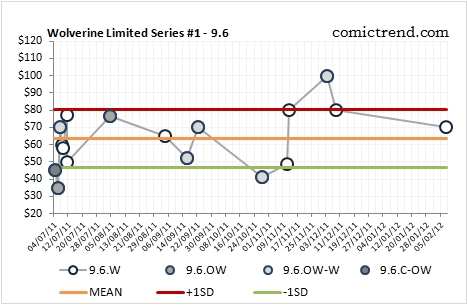
The chart below overlays the mean value and +1 and -1 standard deviations. The standard deviation for this book is approximately $17. Expressed as a percentage of the mean value, this equates to 27%.
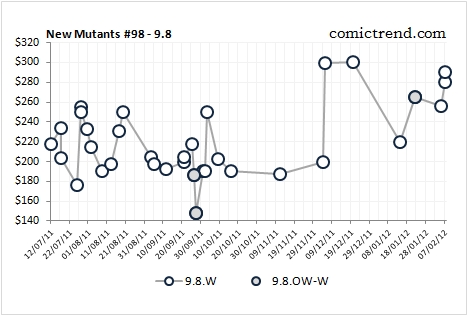
Let’s check out another example. Below is a graph of recent sales for 9.8 graded copies of New Mutants #98. New Mutants #98 is popular because it features the first appearance of Deadpool and its recent value of around $200 allows many collectors a chance to get their hands on a copy.
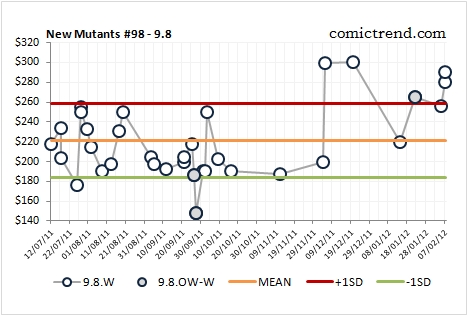
Now we can overlay its mean value of $221 and standard deviation of $37. As a percent of the mean, this works out to 17%.
With this information, books can be bought a bit more wisely. Look at all the transactions for Wolverine #1 and New Mutants #98 that occurred near 1 standard deviation above their means. Notice that these were frequently followed by sales at the mean and below the mean.
At this point the collector has to ask themselves: what is the future going to look like? Perhaps the recent Deadpool values have started to rise because collectors know a Deadpool movie is right around the corner. Alternatively, the fluctuation could be random, like how the values spiked to the $260+ area several times in 2011. If you have a strong opinion that a certain book is going to begin a major uptrend then buying at or below the mean isn’t going to that relevant. Just be careful: history has shown that such trends have a strong tendency to reverse quickly after the hype fades.
Another caveat relates to low census silver age titles or modern variants. These titles do not trade as frequently so collectors may pay a higher price to secure them. Paying up a bit feels a lot better than letting a rare, long desired title out of your grasp.
What it is really fascinating is that comic book volatility tends to be very similar to stock market volatility. I have calculated the standard deviation for at least 50 titles—with about 4 grades each—and the annual standard deviation tends to be between 15-30%. Do as the pros do: be aware of the stats and don’t pay up for frequently traded titles. Patience pays.


